
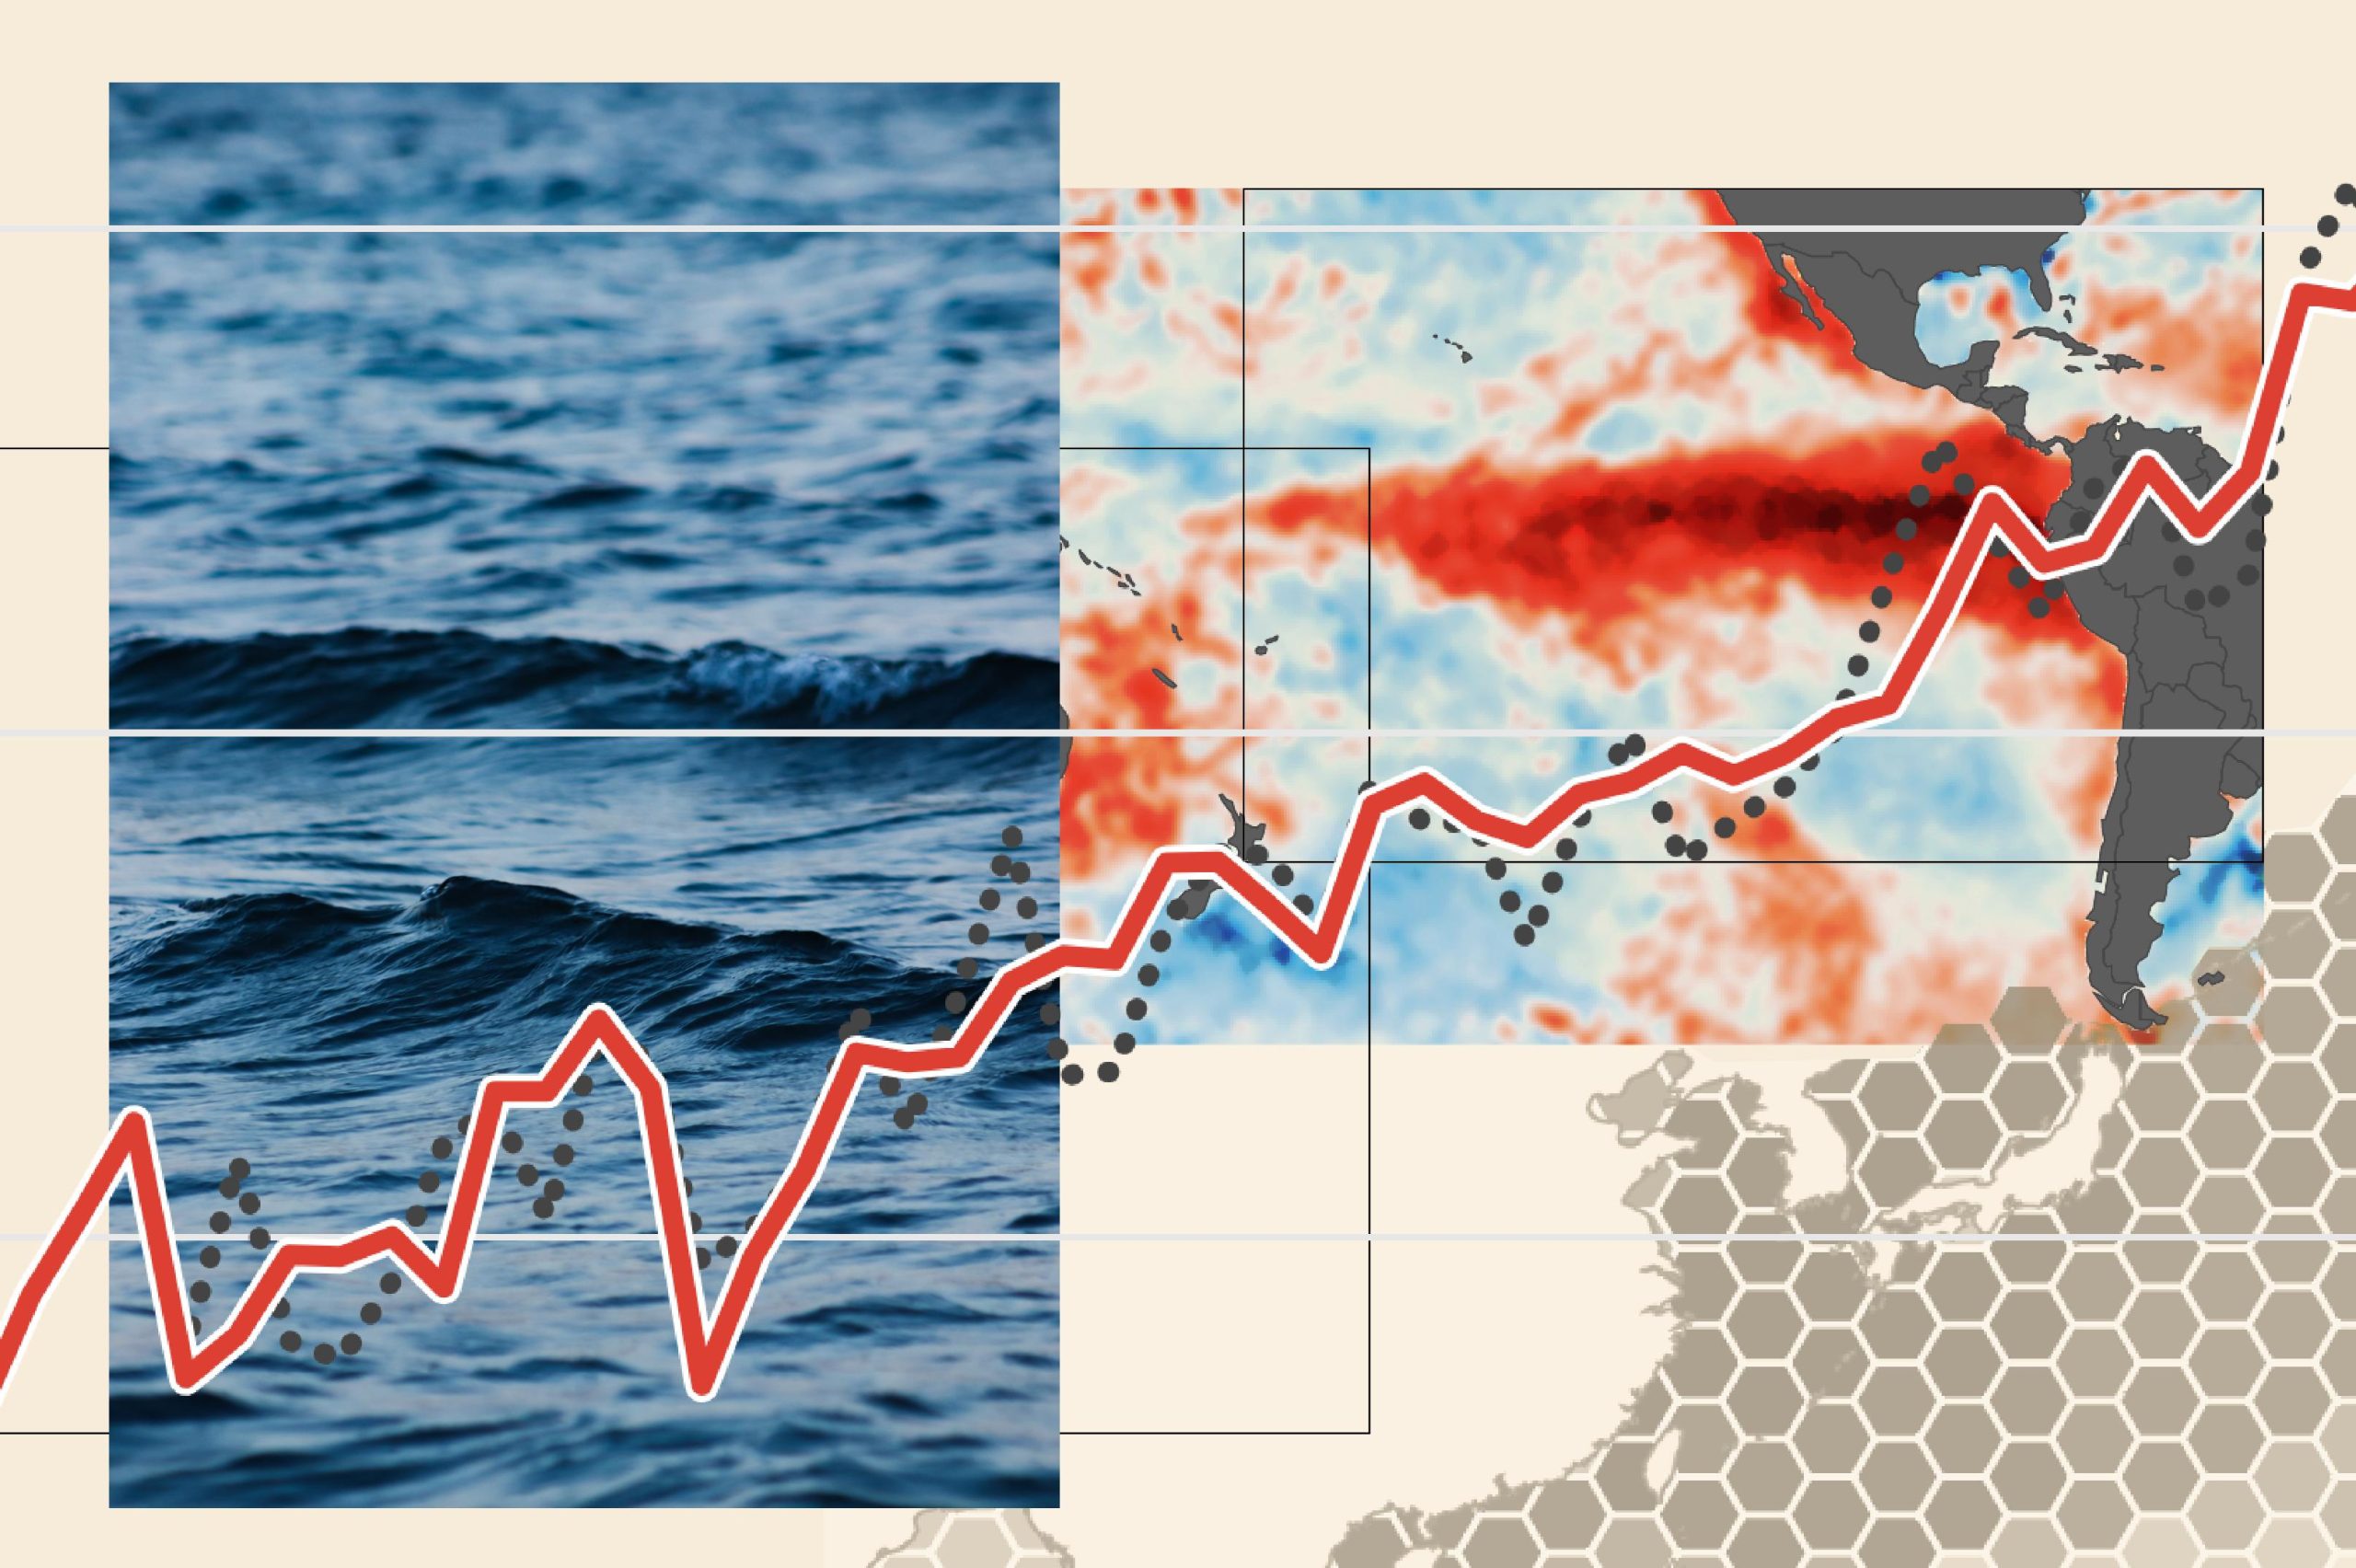

Every major weather shift begins somewhere. Sometimes, the first clues are not found in clouds, storms, or temperature records on land, but in the enormous Pacific Ocean.
In 2026, scientists are closely monitoring a developing El Niño, a natural climate pattern that can influence rainfall, temperatures, drought conditions, and storm activity across multiple continents. NASA satellites are helping researchers observe changes across the tropical Pacific, while ocean buoys, ship measurements, and NOAA climate models add important information about what may happen next.
The science is a little like a planet-sized experiment. Researchers cannot control the ocean, but they can measure its changing conditions, track how heat moves, and investigate how those changes affect the atmosphere. The goal is not to predict every storm months in advance. It is to better understand the larger patterns that shape the world’s weather.
What Is El Niño, and Why Does It Matter?
El Niño is one phase of the El Niño–Southern Oscillation, commonly known as ENSO. This climate pattern involves interactions between the tropical Pacific Ocean and the atmosphere above it. During El Niño, sea-surface temperatures in the central and eastern equatorial Pacific become warmer than their long-term averages, while winds, air pressure, and rainfall patterns shift.
Under typical conditions, trade winds blow from east to west across the tropical Pacific. They help push warm surface water toward Indonesia and Australia, allowing cooler water to rise near the coast of South America. This circulation influences where warm, moist air rises and where rainfall develops.
During El Niño, the trade winds often weaken, and warm water spreads farther east. The normal pattern of rising and sinking air changes, moving areas of heavy rainfall and influencing atmospheric circulation beyond the Pacific.
That is how a change in ocean temperature can affect weather thousands of miles away.
NASA and NOAA reported in October 2026 that the current event was strengthening. NOAA’s October 8 assessment described a strong-to-very-strong El Niño as likely through January–March 2027, while emphasizing that regional effects are not guaranteed. <Cite refs={[“turn339605search0″,”turn339605search3”]}/>
The distinction matters: El Niño changes the odds of certain weather patterns. It does not dictate exactly what the weather will be in every city.
How Satellites Measure an Ocean That Never Stands Still
The Pacific Ocean covers an immense area, and its conditions can change over days, weeks, and months. A handful of ships or floating instruments cannot observe every region continuously. Satellites help fill those gaps by collecting measurements across broad stretches of the ocean.
One of the most important measurements is sea-surface temperature. Satellite instruments called radiometers detect energy emitted by the ocean, including infrared and microwave signals. Scientists use these measurements, along with readings from buoys and ships, to estimate ocean temperatures and map areas that are warmer or cooler than average. Infrared instruments can be affected by clouds, while microwave observations can provide additional information in cloudy conditions. <Cite refs={[“turn339605search14″,”turn339605search0”]}/>
These temperature maps help scientists identify the broad band of unusually warm water associated with El Niño. Researchers compare the observations with long-term averages to determine whether the ocean is developing a sustained warm pattern rather than experiencing a brief local fluctuation.
But temperature is only one piece of the puzzle.
Another powerful tool is satellite radar altimetry, which measures the height of the ocean’s surface. The Sentinel-6 satellites send radar pulses toward the water and measure the time it takes for the reflected signal to return. After accounting for the satellite’s position and other factors, scientists can calculate sea-surface height with remarkable precision.
Why measure height when the concern is heat?
Warm water expands. When a large volume of warmer water gathers in a region, it can contribute to a higher sea surface. Changes in sea level can therefore provide clues about the distribution of heat in the ocean, including large-scale movements beneath the surface.
NASA’s October 2026 observations compare sea-surface temperature anomalies with sea-surface height anomalies to track the developing event. The Sentinel-6 missions measure ocean height across the global ocean, providing an important complement to temperature measurements and in-water observations. <Cite refs={[“turn339605search0″,”turn339605search1”]}/>
These instruments do not directly measure every layer of the ocean. Instead, scientists combine their observations with subsurface measurements, ocean physics, and computer models to build a more complete picture.
The Hidden Heat Moving Beneath the Surface
An ocean can store enormous amounts of energy below the surface, even when surface conditions do not tell the whole story. That is why researchers monitor subsurface temperatures as well as what satellites can observe from orbit.
During the early development of the 2026 El Niño, NASA identified a warm-water pulse known as a Kelvin wave in the western Pacific. These waves can carry warm water eastward along the equator. As the water moves, it can help change sea-surface height and temperature patterns across the Pacific.
Think of it as a slow-moving underwater conveyor belt. It does not transport heat like a mechanical machine, but it helps scientists understand how warm water can shift across an enormous ocean basin.
The atmosphere responds as this heat is redistributed. Warm ocean surfaces transfer energy and moisture into the air above them, helping influence cloud formation and rainfall. Changes in winds can also affect how heat is distributed within the ocean, creating feedback between the sea and atmosphere.
The key insight is that El Niño is not simply a patch of warm water. It is a connected system involving the ocean’s surface, deeper layers, winds, air pressure, clouds, and rainfall.
From Ocean Heat to Weather on Other Continents
Once scientists identify a developing El Niño, the next question is how the changing Pacific might influence weather around the world.
The tropical Pacific is a major source of heat and moisture for the atmosphere. When the location of warm water and rising air changes, it can alter large-scale circulation patterns. Those changes can influence the jet stream, the tracks followed by weather systems, and the distribution of rain and dry conditions in distant regions.
The effects vary by season and location. In parts of South America, El Niño can increase the risk of unusually heavy rainfall and flooding. Some areas of Australia and Indonesia may face drier conditions. In North America, El Niño can influence winter storm tracks and seasonal temperatures, although the outcome depends on other atmospheric conditions as well.
El Niño can also change the environments in which tropical cyclones develop. Its influence differs between ocean basins: wind patterns that make hurricane formation less favorable in one region can have different consequences elsewhere.
These are broad tendencies, not guarantees. Two El Niño events can produce different outcomes because their timing, strength, location, and interaction with other climate patterns are not identical.
Climate scientists therefore use historical records and computer models to examine probabilities rather than promise a precise forecast for every place. The developing 2026 event has attracted attention because of its strength, but scientists must continue evaluating observations and seasonal outlooks as conditions evolve. <Cite refs={[“turn339605search3″,”turn339605search14”]}/>
How Scientists Turn Satellite Data Into Forecasts
Satellites provide measurements, but measurements alone do not explain what will happen next. Researchers combine satellite observations with information from ocean buoys, weather stations, ships, atmospheric sensors, and historical climate records.
These datasets are processed into maps and indicators that show how current conditions compare with typical conditions. Scientists then use climate models to simulate interactions between the ocean and atmosphere and explore how the pattern might develop over the coming months.
Forecasting involves uncertainty. A model may predict that El Niño will strengthen, for example, but it cannot know with certainty how every regional weather system will respond. Different models can produce different results, and forecasts generally become less precise the farther they extend into the future.
Scientists improve confidence by comparing multiple sources of evidence. If sea-surface temperatures, ocean-height measurements, subsurface observations, and atmospheric indicators point toward the same evolving pattern, researchers have a stronger basis for assessing what is happening.
NASA’s Earth-observing missions contribute the large-scale view, while NOAA’s climate monitoring and forecasting work helps turn those observations into assessments of ENSO conditions and potential seasonal effects. <Cite refs={[“turn339605search0″,”turn339605search3”]}/>
This collaboration illustrates an important principle of climate technology: no single satellite or measurement tells the entire story. Better understanding comes from combining different kinds of evidence.
Ocean Color Offers Another Clue
Temperature and sea level are not the only things satellites can observe. The color of the ocean can also reveal changes in marine ecosystems.
NASA’s PACE satellite carries an Ocean Color Instrument that measures light reflected from the ocean across many wavelengths. These observations help scientists estimate the concentration of chlorophyll-a, a pigment found in most phytoplankton—the tiny organisms that form the foundation of many marine food webs.
During El Niño, warmer surface waters can reduce the supply of nutrients reaching some parts of the ocean’s surface. In regions where this happens, phytoplankton populations may decline, changing the amount and type of light reflected by the water.
NASA reported in 2026 that satellite observations were detecting changes in ocean color and phytoplankton patterns associated with the developing El Niño. Such changes can provide clues about how shifts in ocean circulation affect marine life, fisheries, and the wider food web. <Cite refs={[“turn339605search0″,”turn339605search11”]}/>
This does not mean ocean color alone can confirm El Niño. Instead, it offers another layer of evidence about the consequences of changing ocean conditions. By examining temperature, height, and color together, scientists can study both the physical movement of ocean heat and some of its ecological effects.
What This Means for Communities
Understanding El Niño is useful because seasonal climate shifts can influence decisions made well before a storm or drought begins.
Farmers may use seasonal outlooks when considering planting schedules, irrigation needs, and crop choices. Water managers can examine the possibility of unusually wet or dry periods when planning reservoir operations. Emergency planners can review flood, heat, and drought risks, while coastal communities can use improved ocean observations as one source of information when preparing for changing conditions.
The forecasts are not a substitute for local weather warnings, and they cannot remove uncertainty. Instead, they provide additional time to consider possible scenarios and prepare flexible plans.
The value of climate technology is often greatest when it helps people make informed decisions before a hazard becomes an emergency.
It is also important to separate El Niño from climate change. El Niño is a naturally recurring climate pattern, while human-caused global warming is driven primarily by greenhouse gases released into the atmosphere. The two can interact, and an El Niño year can add to global temperatures that are already elevated by long-term warming. However, El Niño does not explain the entire trend in global temperatures, nor does it cause every extreme weather event.
Researchers study both processes because distinguishing natural variability from long-term change helps explain what is happening to the climate system.
The Experiment Continues
The developing 2026 El Niño demonstrates how much scientists can learn by observing the planet from space. Satellites track warmer surface waters, measure subtle changes in sea level, and detect changes in ocean color. Buoys and other instruments add information from beneath the surface, while climate models help researchers examine how the ocean and atmosphere may evolve together.
Each observation answers part of the puzzle. A temperature map shows where the ocean is warmer than usual. A sea-level map offers clues about the distribution of warm water. Atmospheric measurements help reveal whether winds, clouds, and rainfall are responding as expected.
Together, those signals help scientists understand how a change in one ocean basin can influence weather patterns around the world.
El Niño is not a perfectly predictable experiment, and the planet is far too complex for a single forecast to explain every outcome. But with more continuous observations and better ways to combine data, researchers can recognize important changes sooner and improve the information available to communities.
The ocean may seem distant from everyday life, but its heat can influence rainfall, agriculture, ecosystems, and seasonal weather far beyond the Pacific.
By watching those changes from orbit, scientists are learning to read some of the earliest signals of a changing global climate—and giving the world a better chance to prepare for what comes next.
References
- NASA Science — NASA Satellites Observe Historic 2026 El Niño
- NASA Scientific Visualization Studio — Signs of El Niño in 2026
- NOAA — El Niño Forms, Expected to Strengthen, Say NOAA Forecasters
- NOAA Climate Prediction Center — ENSO Diagnostic Discussion
- NASA Science — El Niño: How NASA Observes the Climate Pattern
- NASA Science — El Niño Alters Marine Life in the Pacific

Leave a Reply